The ScrollLab Archive
A digital-physical library of violin scrolls
A digital-physical archive of head models from historical and contemporary instruments. The preserved geometry makes it possible to analyse and compare their form, and to use it as a reference in the workshop.
Master Scrolls
Historical models
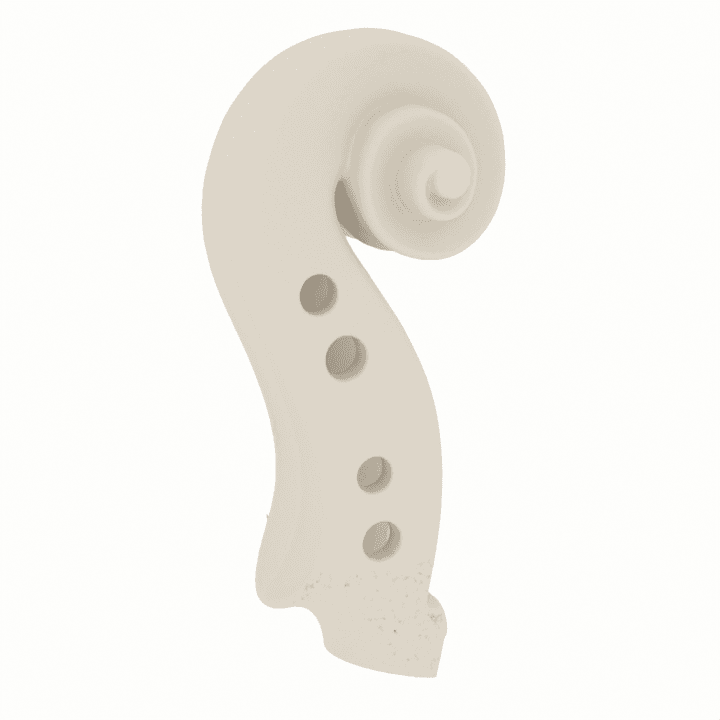
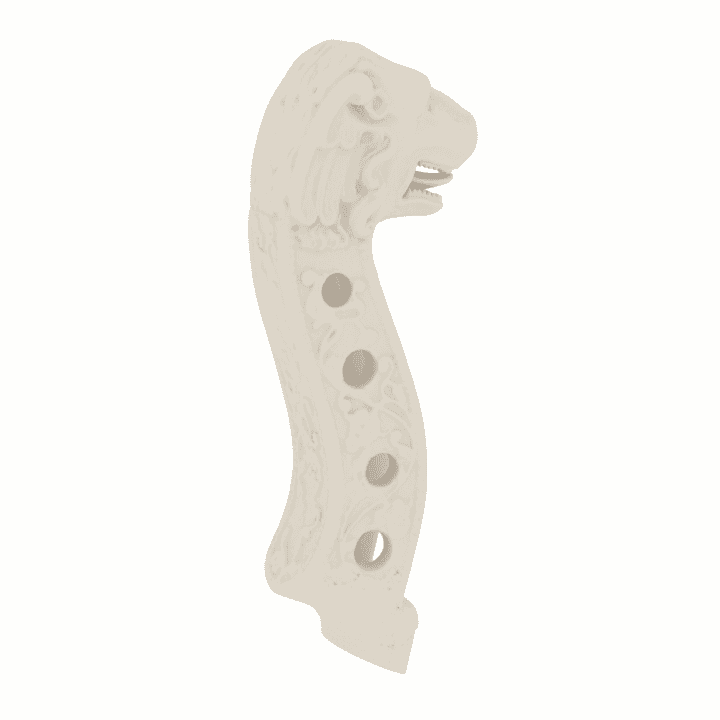
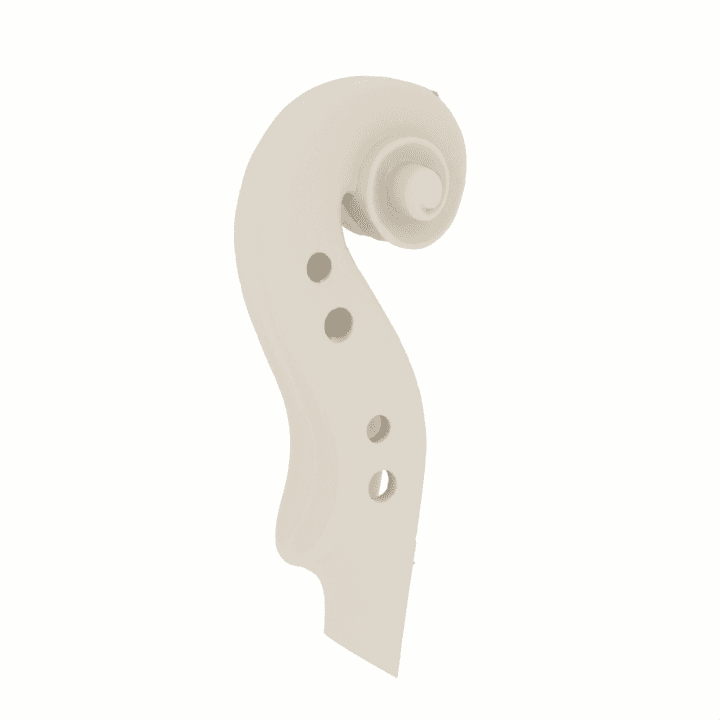
Head models developed directly from original historical instruments. They preserve their true geometry and the individual features of their form as material for analysis, comparison and bench work.
Contemporary Master Scrolls
Contemporary models
A growing collection of head models from contemporary instruments made by recognised luthiers. The collection documents the individual features of form and craft of today’s makers.
First models in development
Contemporary Master Scrolls
How to read the analysis
How the models are prepared and validated, and how to read the results of the geometric analysis.
- What is a physical reference model?
- A physical reference model is a three-dimensional rendering of an instrument’s head, made from a digital model derived from tomographic data. It is produced by high-resolution resin printing and serves as a durable, material master of geometry for analysis, comparison and bench work. Unlike a traditional cast, it keeps the physical object directly linked to its digital source and to the measurement record. The premise of the ScrollLab system is exactly this: models as a means of archiving and analysing the spatial geometry of instruments.
- How is a model made?
- The starting point is data from industrial computed tomography of the instrument. The geometry of the head is extracted from the volumetric data and prepared as a surface model for analysis and manufacture. At this stage no changes affecting the object’s geometry are introduced. The physical model is printed in photopolymer resin at a layer height of 0.02 mm. After printing, the surface is lightly bead-blasted with micro-glass, giving it an even matt finish. This limits reflections and makes subtle transitions of the surface and the marks of the maker’s tools easier to read.
- What does scan–print–scan validation involve?
- The first model from each new series undergoes a second tomographic examination. Its geometry is then compared with the source model, which makes it possible to quantify the deviations arising across the whole process of producing the physical model. Validation serves to control and establish the parameters of the process. Once verified, subsequent models in the series are produced using the same approved production settings.
- What is a deviation map?
- A deviation map shows the spatial distribution of differences between the surface of the validated physical model and the source geometry. Every analysed area is assigned a deviation value in millimetres. Positive values mark areas lying above the reference surface, negative values below it. The scale shown spans ±0.20 mm and matches the scale used in the laboratory analysis.
- What do the histogram and tolerance thresholds show?
- The histogram shows the distribution of geometric deviations across the analysed surface. It allows one to judge not only the size of the differences but also their share of the whole examined area. The thresholds ±0.01 mm, ±0.05 mm and ±0.20 mm state the share of surface falling within each tolerance range. The percentages refer to the analysed surface of the model.
- How should the result be interpreted?
- The analysis describes the geometric agreement of the whole process leading from the source data to the physical model. It covers preparation of the geometry, printing, post-processing, the second scan, registration of the data and their comparison. The result should not be read as a measurement of the printer’s accuracy. Areas for which no corresponding reference surface can be determined are excluded from the analysis proper and reported separately. This includes, among others, the surfaces created where the model is cut at the neck root.