Master Scrolls · Historical models
Violin head model
Marcin Groblicz Kraków · 17th century
The model was developed from the head of an instrument attributed to Marcin Groblicz, representing the seventeenth-century Kraków school of violin making. The instrument was made available for tomographic examination, allowing digital documentation of its distinctive sculpted head and its preservation as a reference model.
Digital model and agreement analysis
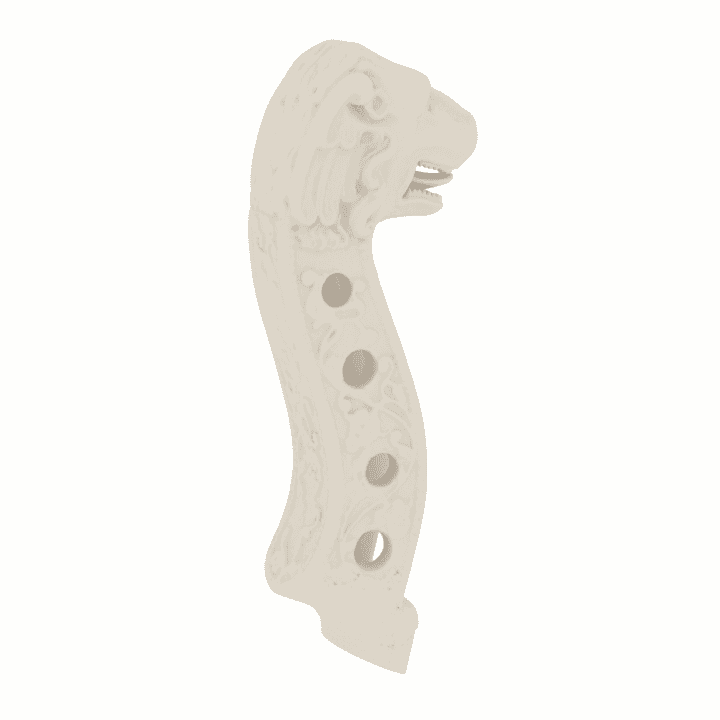
Deviation [mm]
no measurement
The slider overlays the deviation map on the model: 0 % — neutral model, 100 % — full map.
Left button: rotate · right: pan · wheel: zoom
Geometric agreement analysis
Comparing the surface of the physical model with the source geometry makes it possible to determine the size and distribution of the deviations arising in the making of the model.
- Mean deviation
- +0.013 mm
- Median deviation
- +0.003 mm
- Surface within ±0.01 mm
- 11.3 %
- Surface within ±0.05 mm
- 51.0 %
- Surface within ±0.10 mm
- 75.3 %
- Surface within ±0.20 mm
- 93.8 %
- Surface with measurement
- 93.4 %
deviation [mm]
Outside the ±0.20 mm range of the chart: 6.23 % of the analysed surface.
Distribution of deviations — data
| From [mm] | To [mm] | Share |
|---|---|---|
| −0.200 | −0.175 | 0.91 % |
| −0.175 | −0.150 | 1.13 % |
| −0.150 | −0.125 | 1.68 % |
| −0.125 | −0.100 | 2.60 % |
| −0.100 | −0.075 | 3.96 % |
| −0.075 | −0.050 | 7.64 % |
| −0.050 | −0.025 | 13.32 % |
| −0.025 | +0.000 | 14.93 % |
| +0.000 | +0.025 | 12.77 % |
| +0.025 | +0.050 | 9.98 % |
| +0.050 | +0.075 | 7.32 % |
| +0.075 | +0.100 | 5.38 % |
| +0.100 | +0.125 | 3.78 % |
| +0.125 | +0.150 | 2.97 % |
| +0.150 | +0.175 | 2.99 % |
| +0.175 | +0.200 | 2.40 % |
Reading the deviations
A positive value means the surface of the physical model lies outside the source geometry — a local excess of material. A negative value means a surface below the reference geometry — a local deficit.
The percentages refer only to the surface for which a corresponding point on the source model could be determined unambiguously. Areas without a reliable counterpart are excluded from the calculation.
Method of analysis
The analysis was carried out on two sets of surface data: the source geometry extracted from the tomography of the instrument, and the surface of the physical model obtained during its control scan. The two models were compared in a common coordinate system prepared in VGSTUDIO MAX. For the analysed surface, local distances to the source geometry were determined, and from them the distribution and the share of surface falling within the adopted tolerance ranges.
Sample views of the analysis
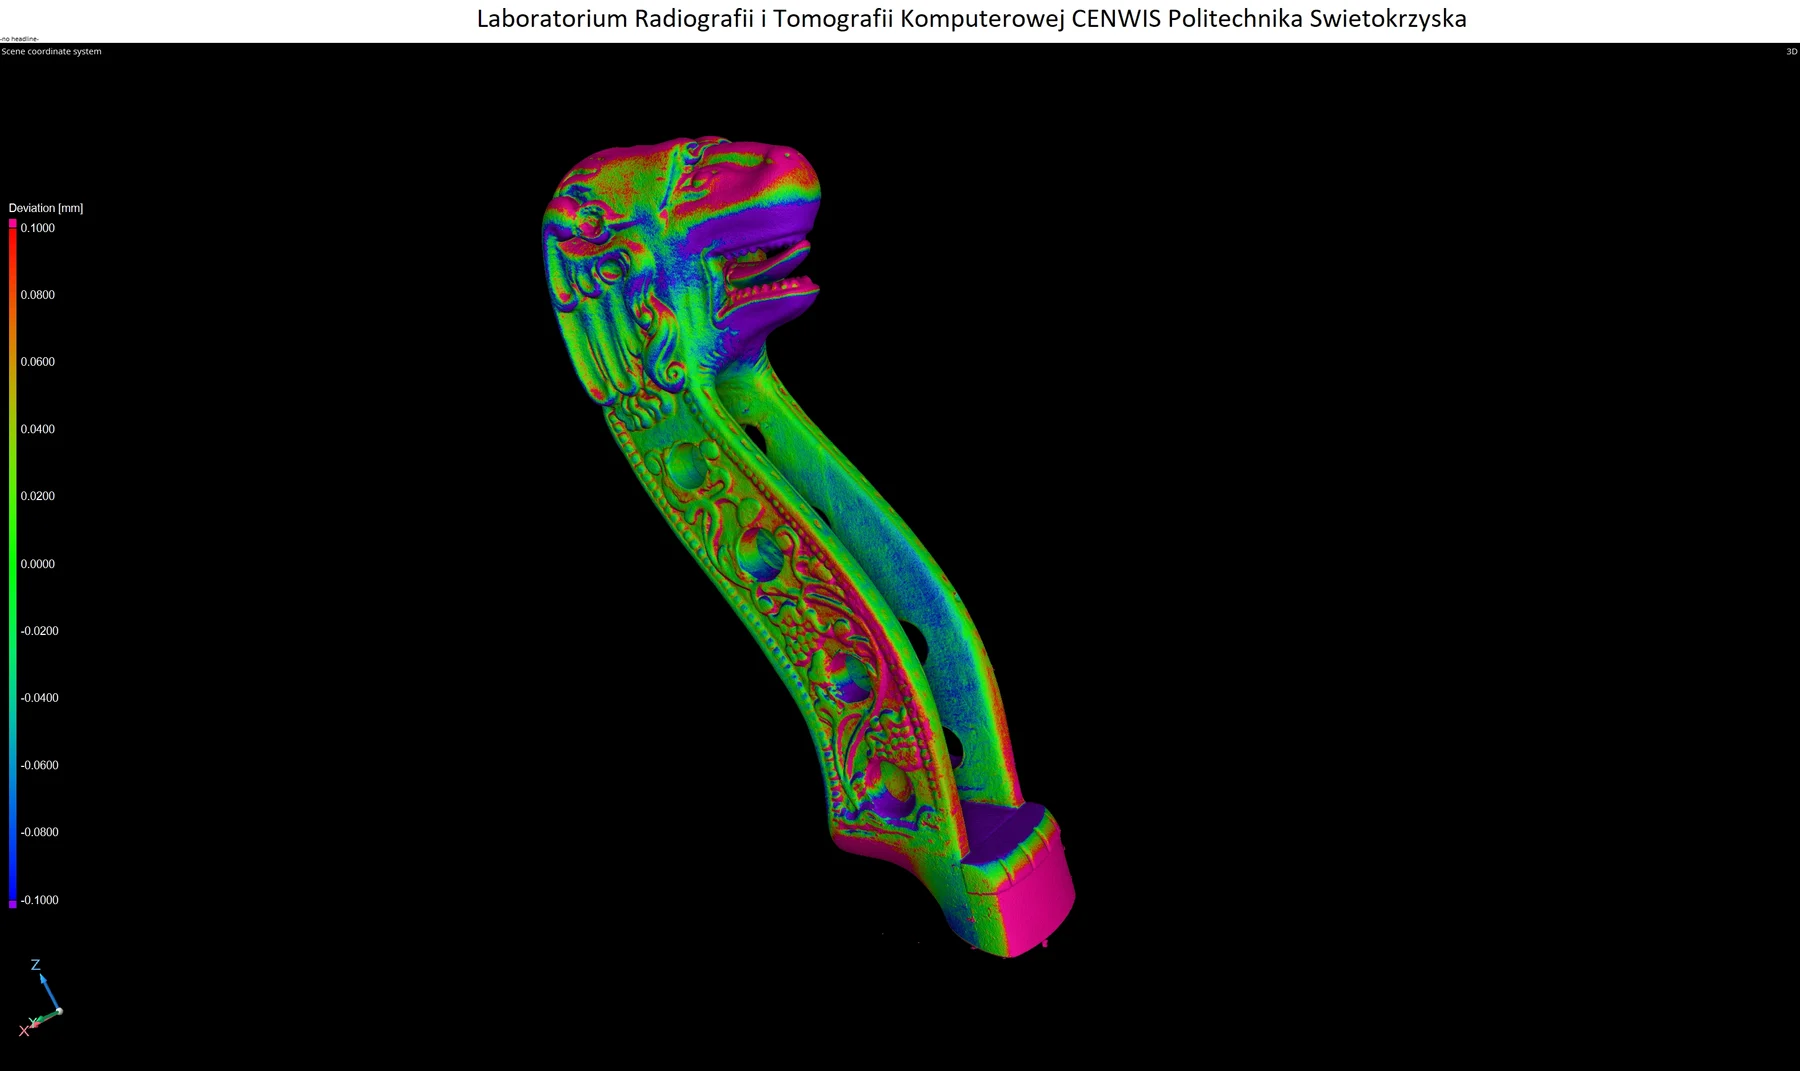
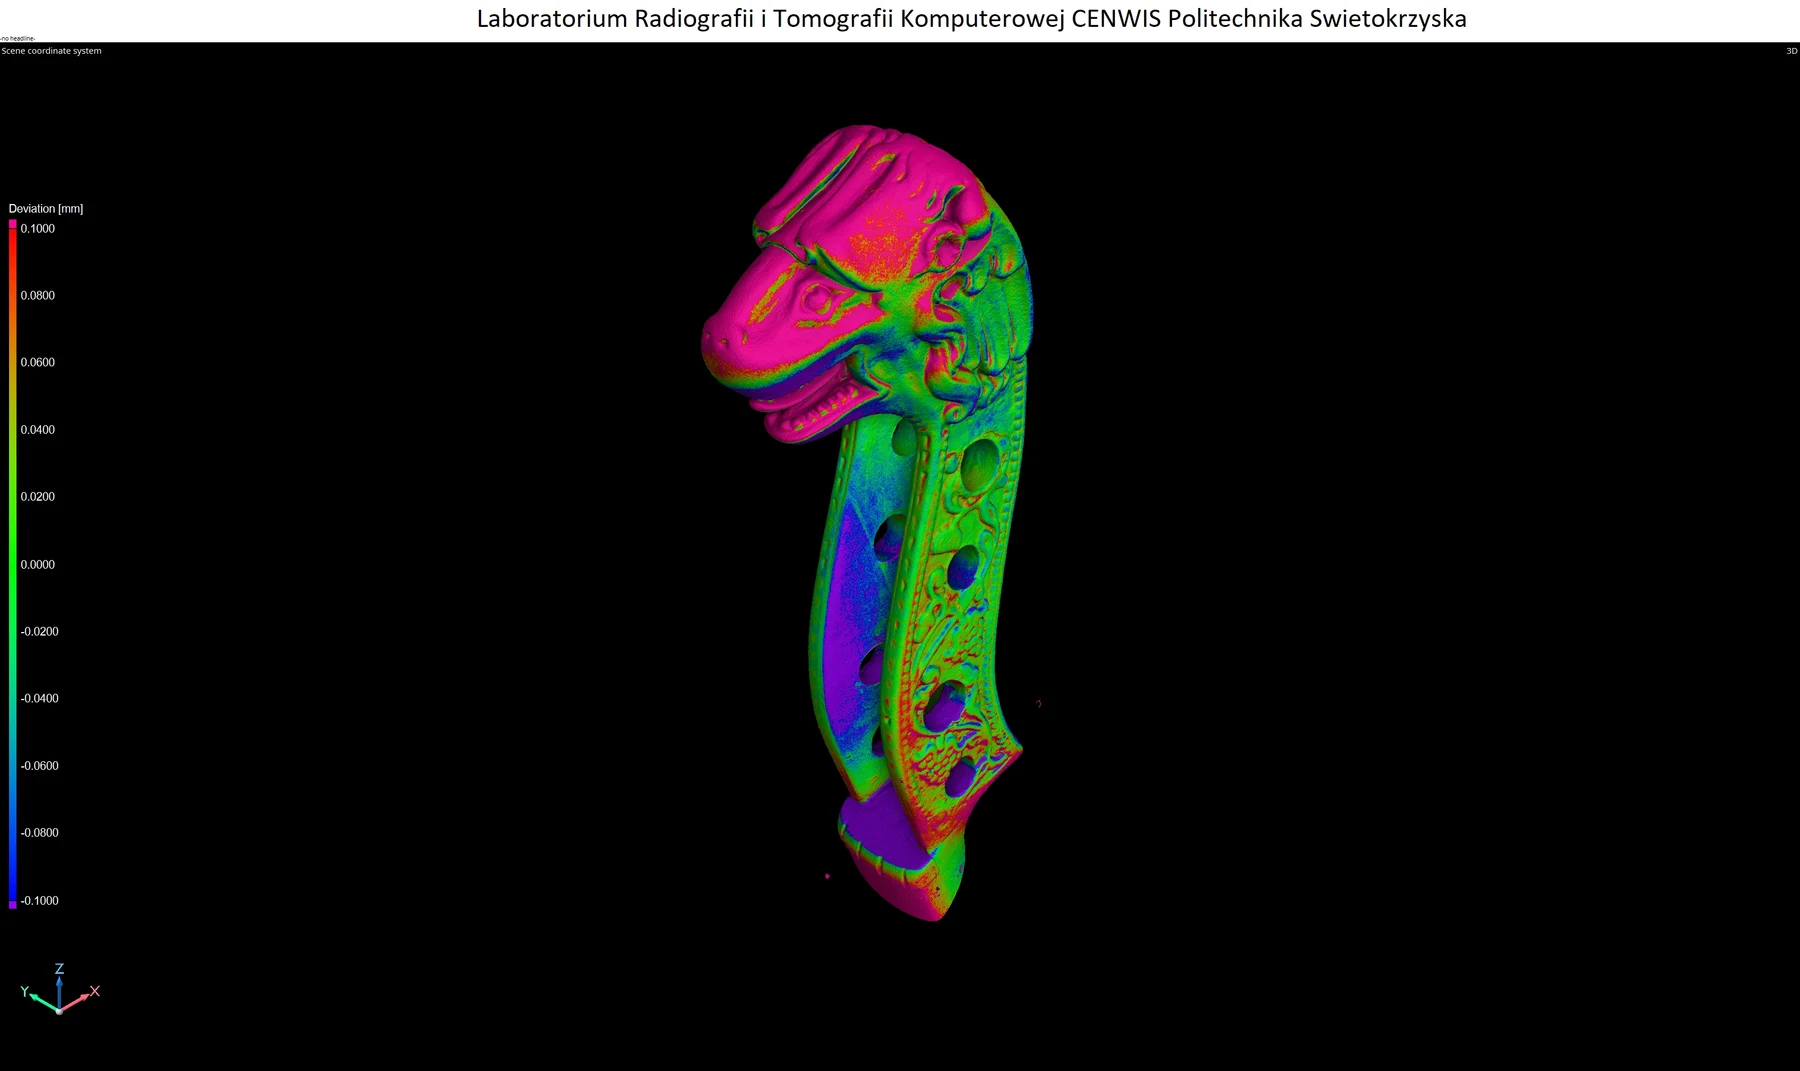
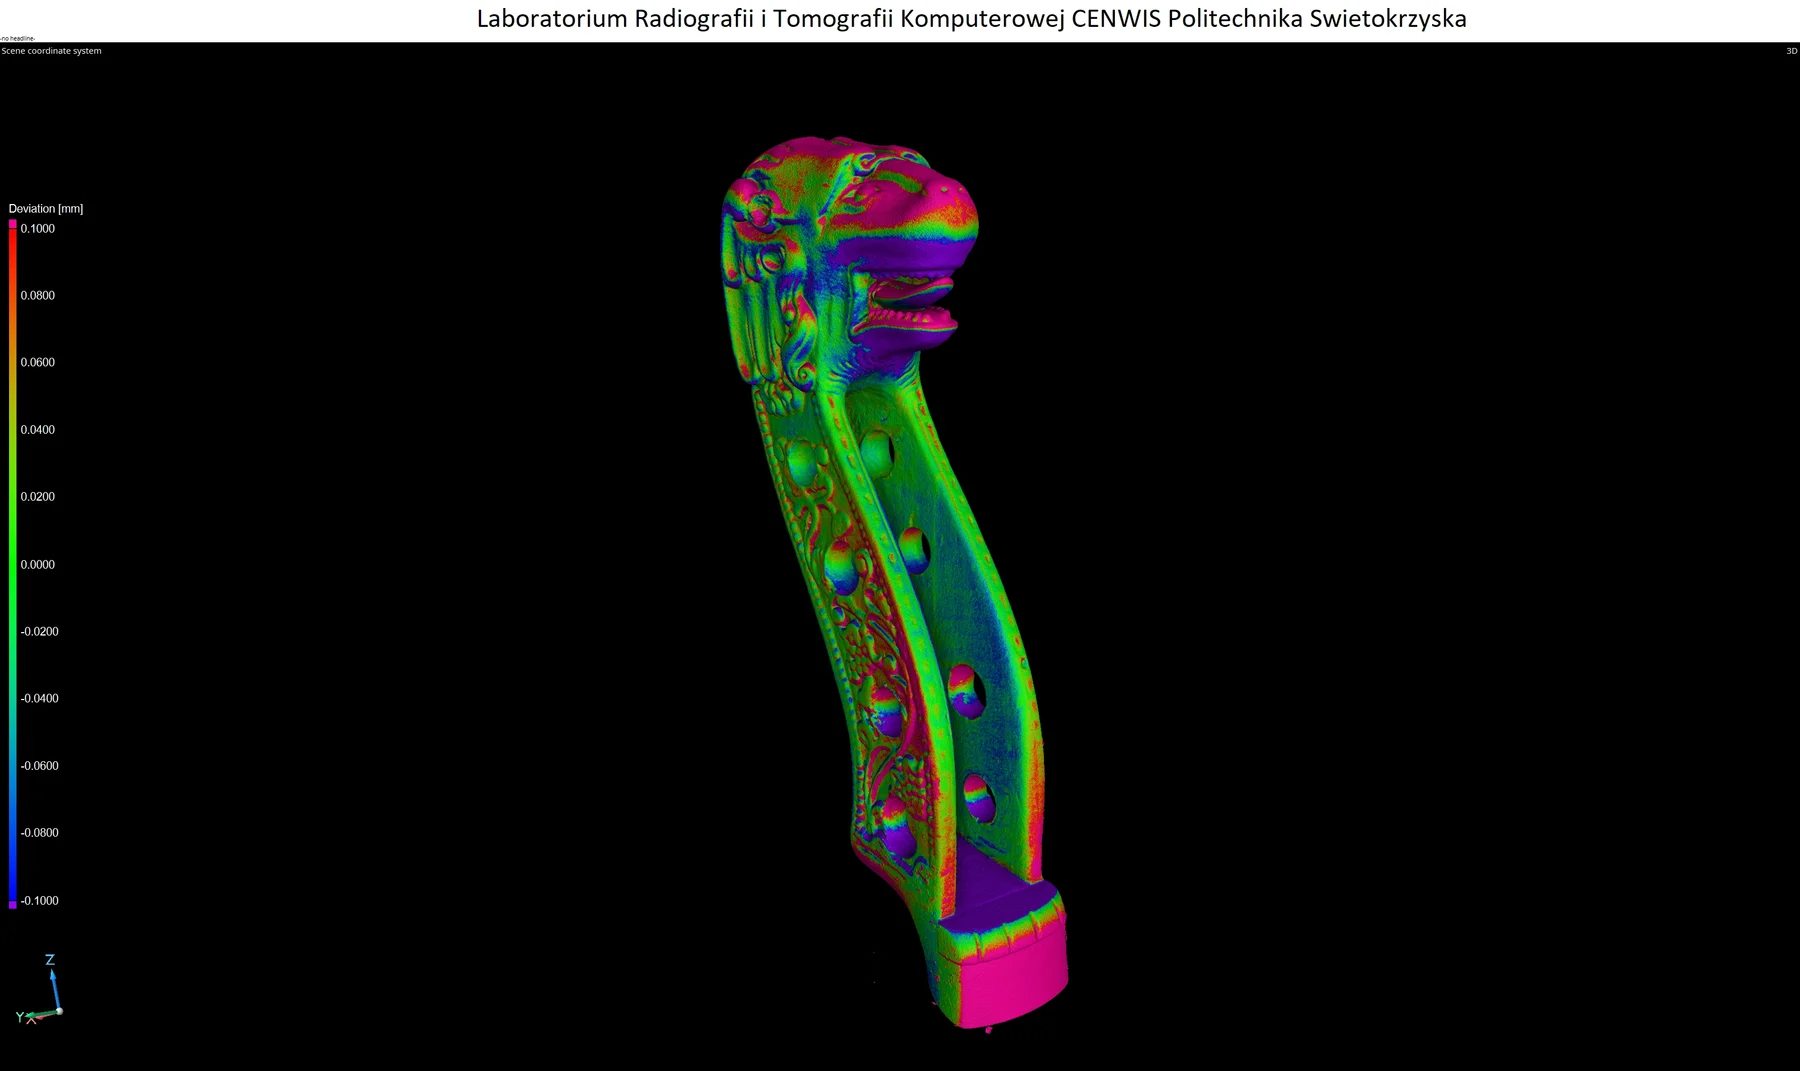
Selected visualisations of the geometric comparison, made in VGSTUDIO MAX during the laboratory analysis.
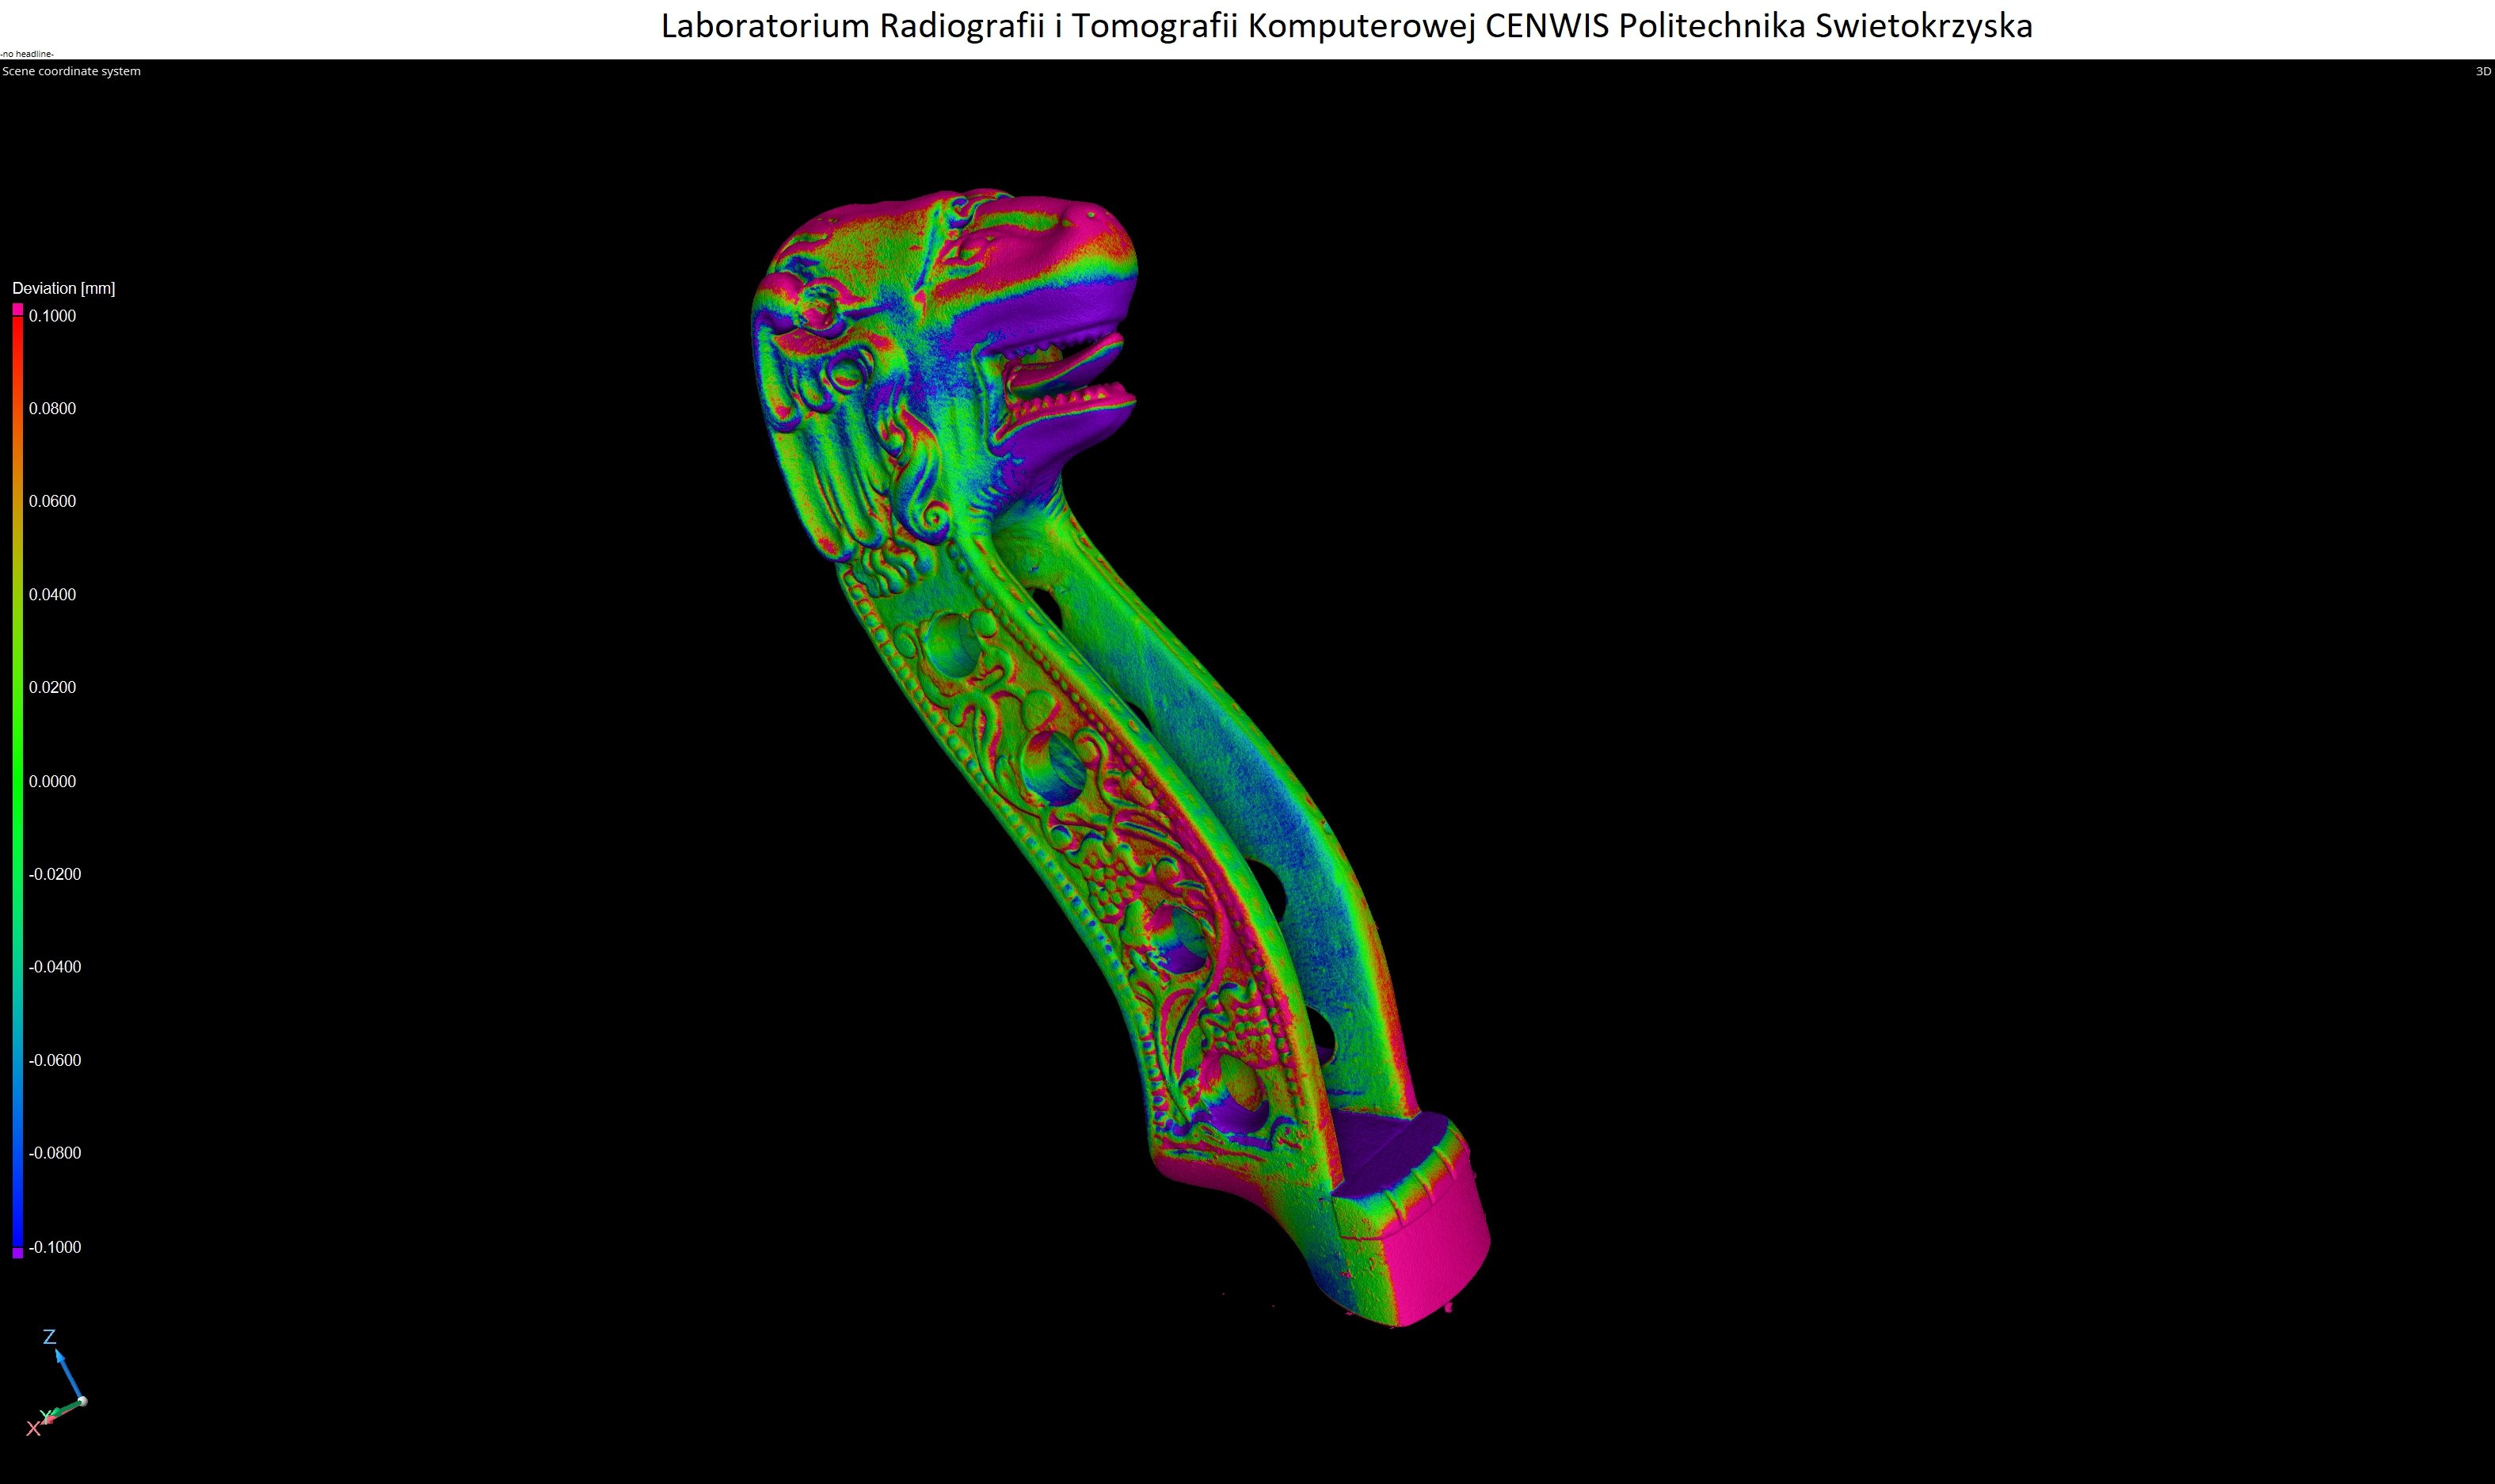
Deviation map · ±0.10 mm range
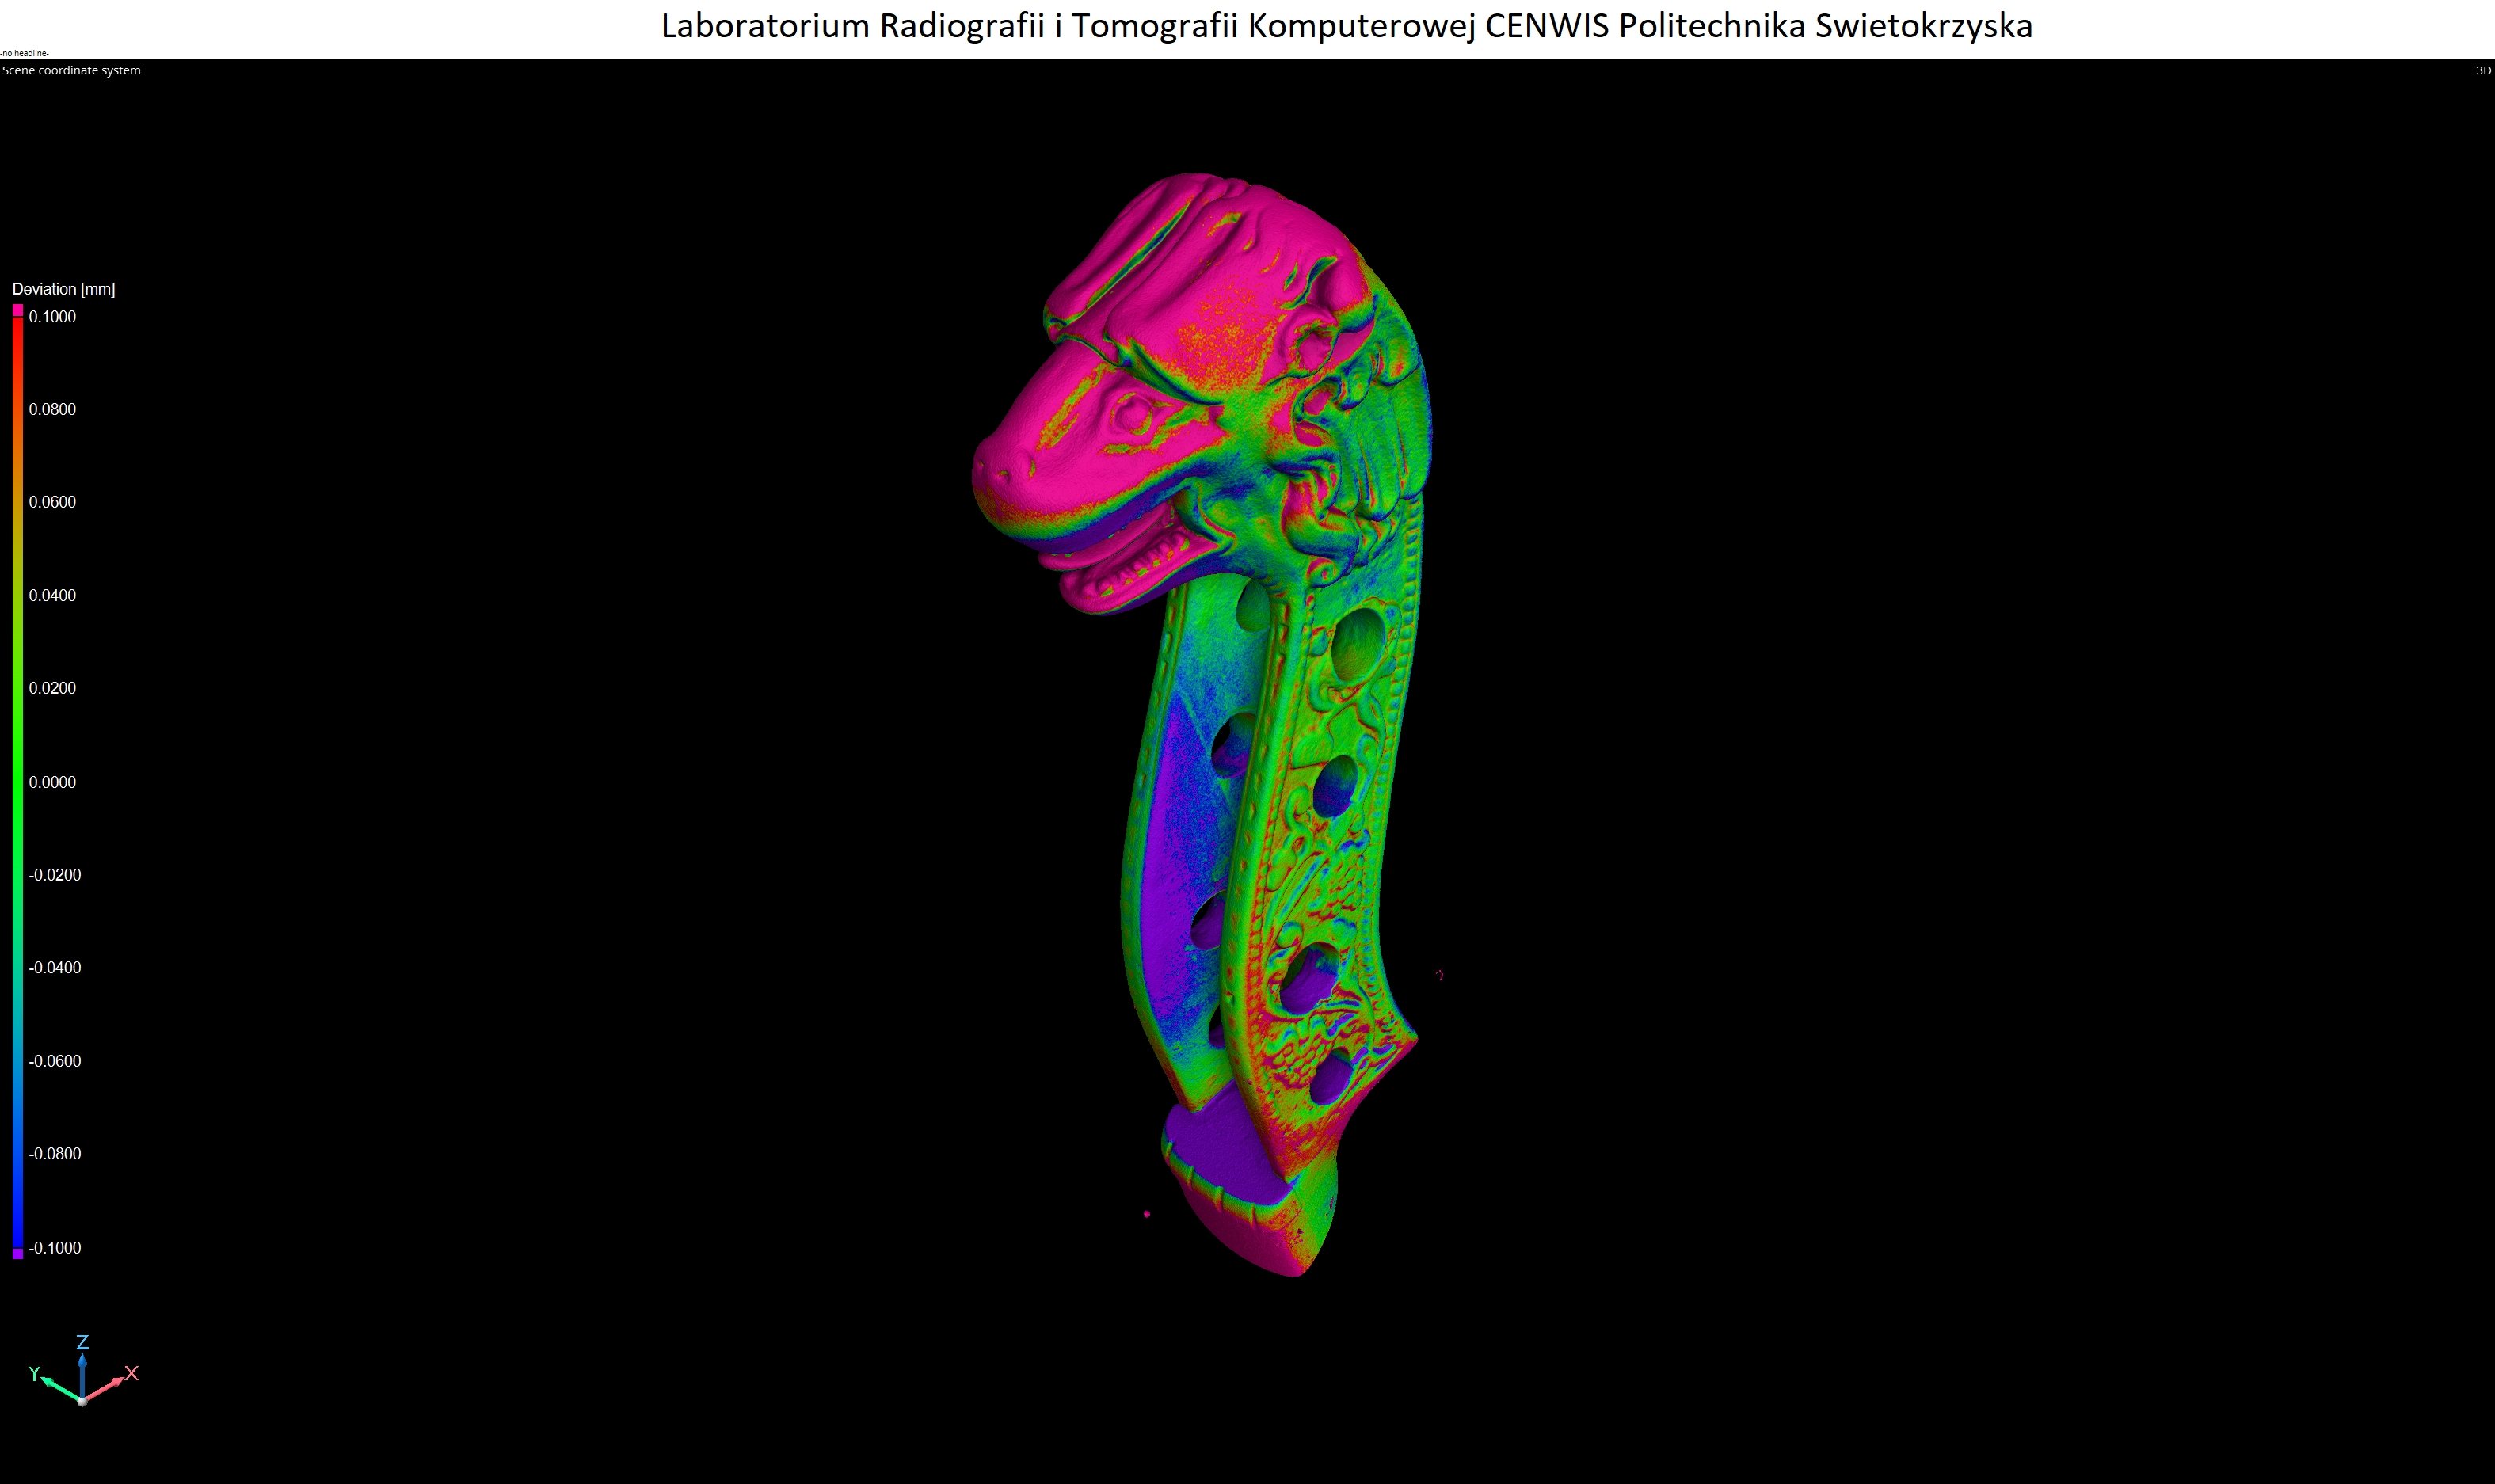
Deviation map · ±0.10 mm range
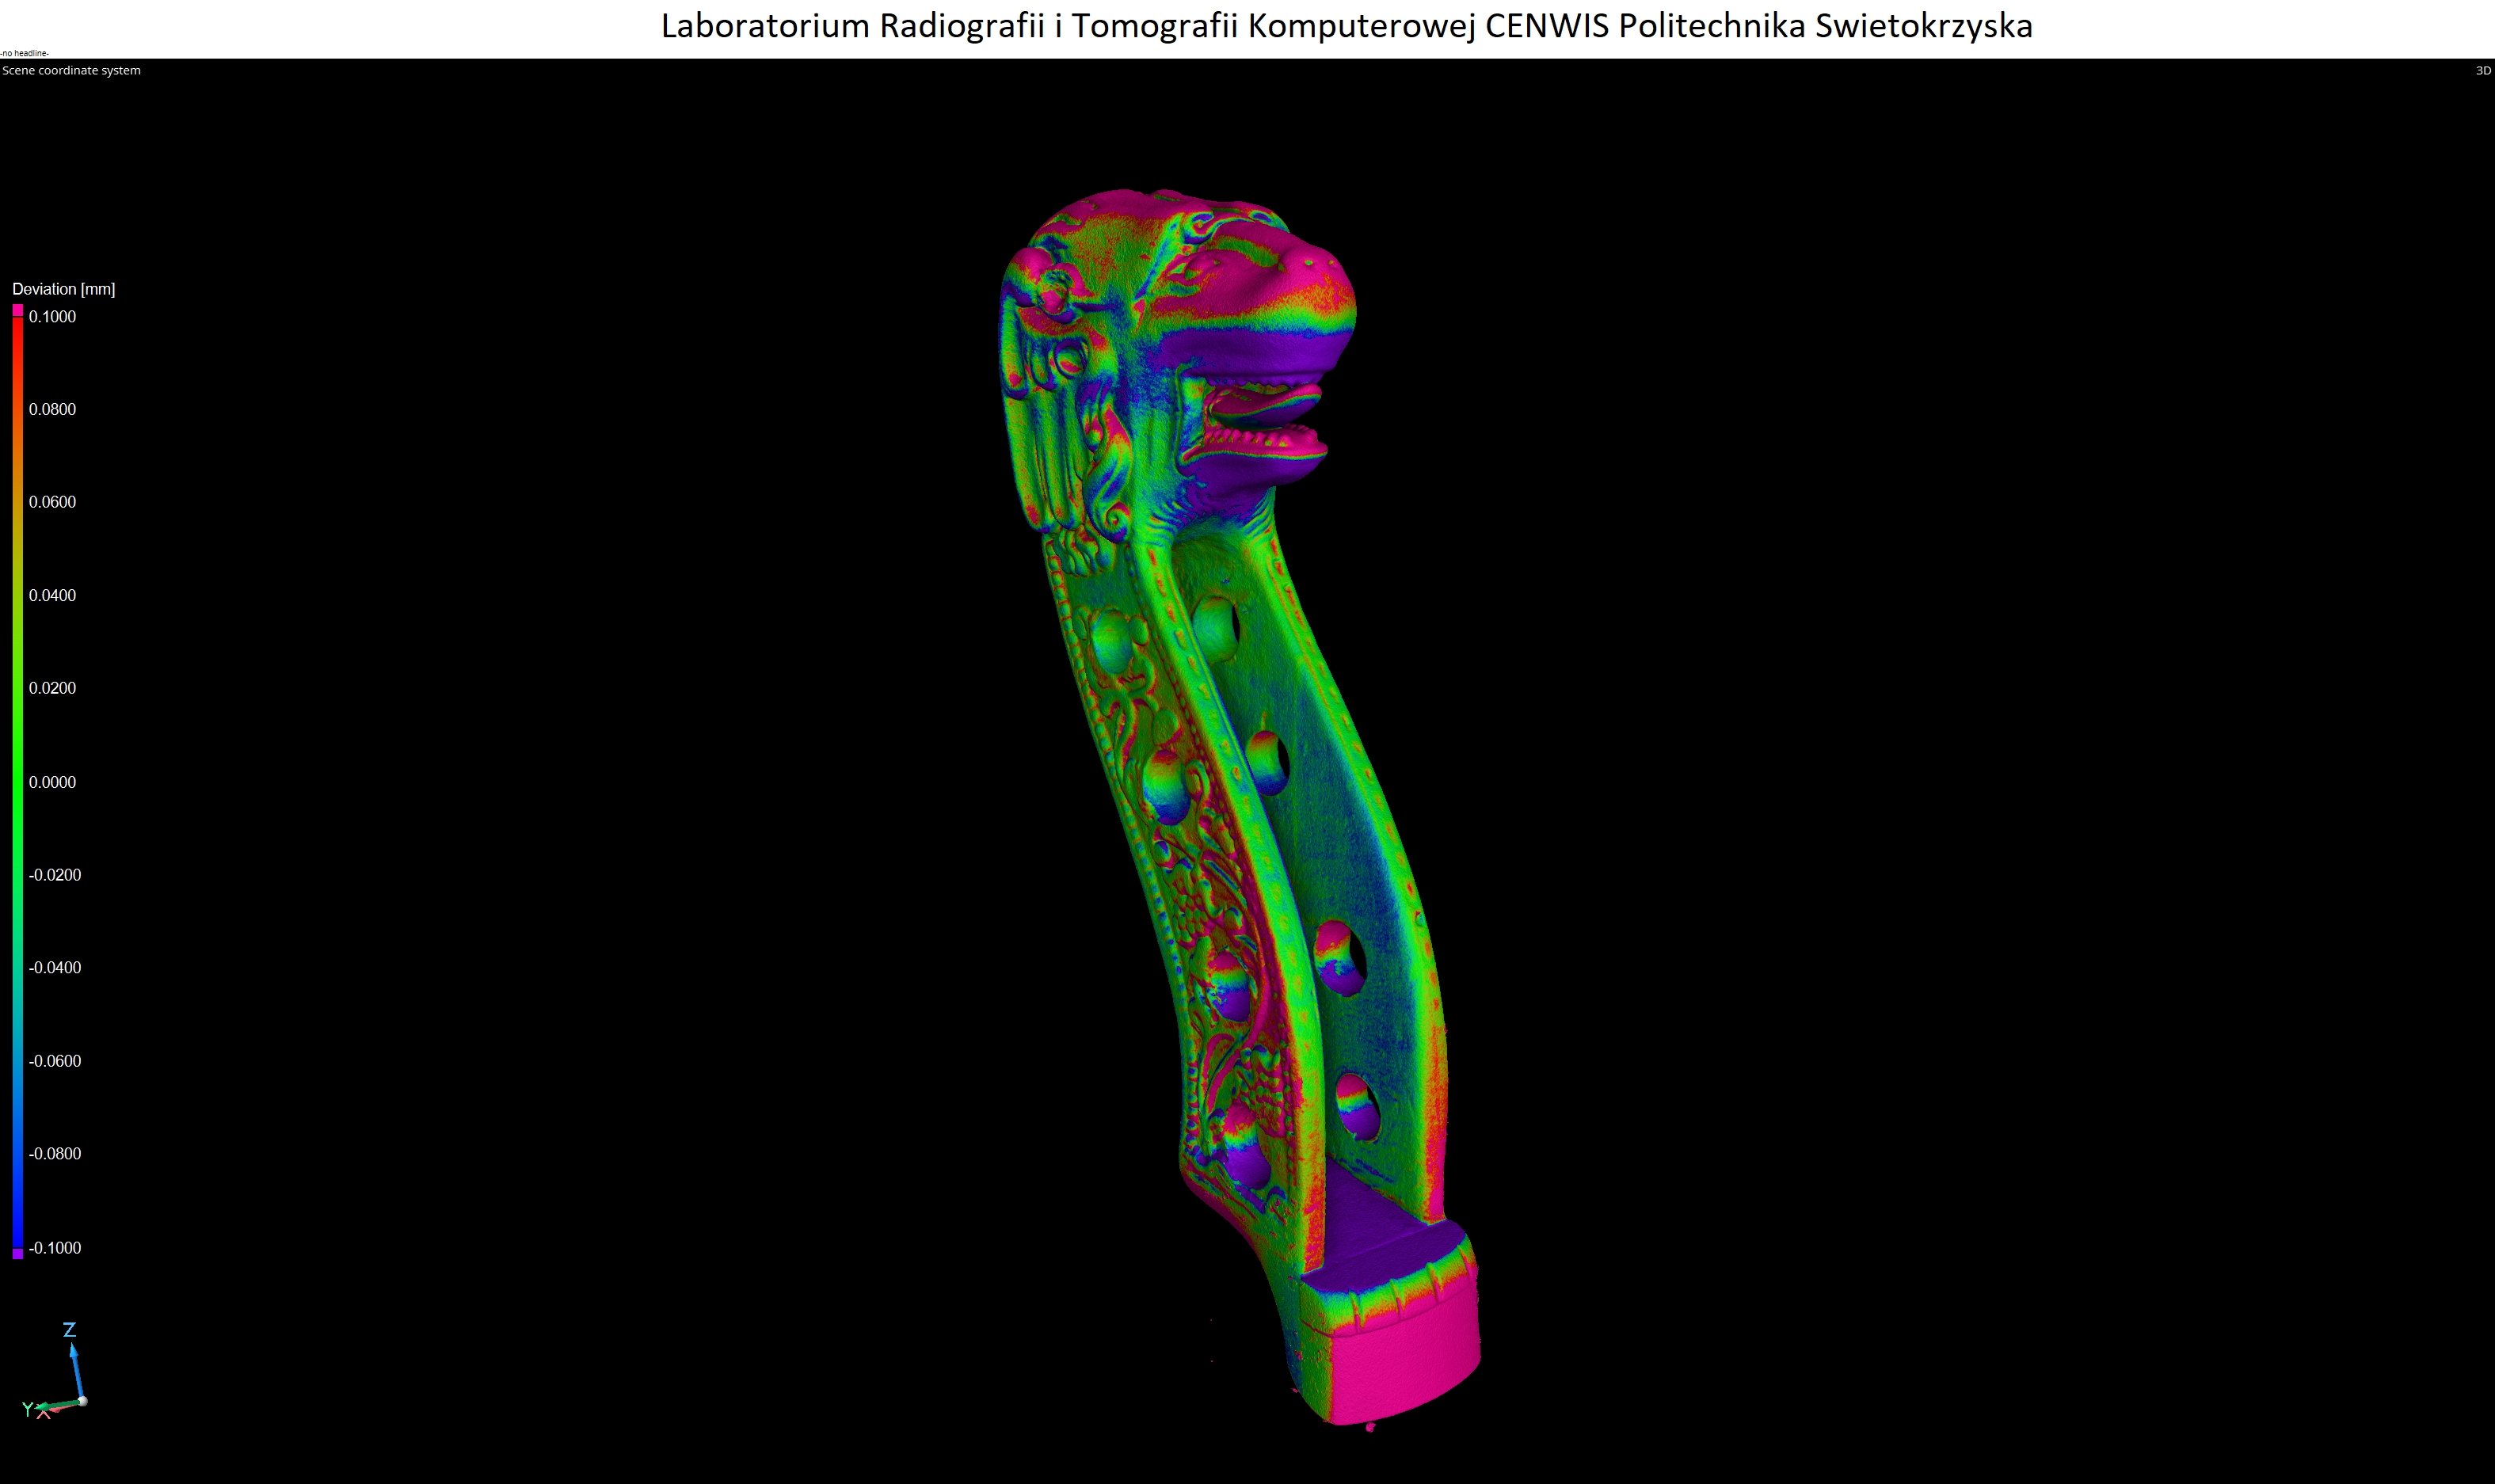
Deviation map · ±0.10 mm range
Model quote
Every model is made individually to order.